
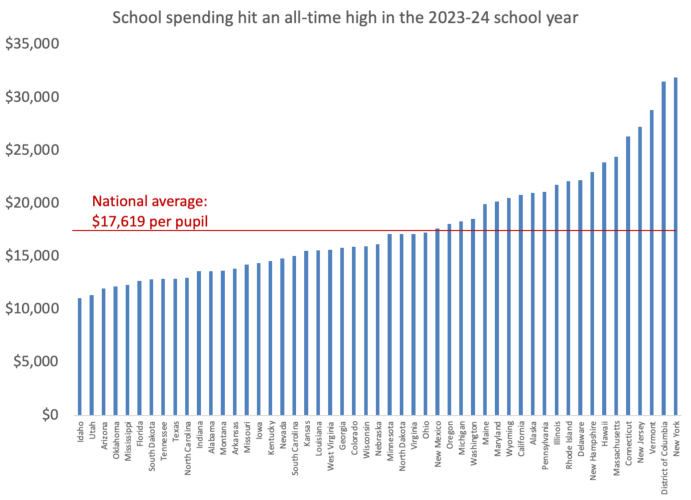
America's K-12 public education system has officially crossed a monumental financial threshold, reaching $1 trillion in revenue for the 2023-24 school year. This staggering figure, while representing income rather than expenditure, illuminates critical shifts in how our schools operate and where resources are directed. For educators and administrators alike, understanding these underlying trends is paramount to navigating the complex landscape of modern education finance and ensuring effective allocation of these vast sums of money.
More Money, Fewer Students: A Shifting Financial Equation
On an inflation-adjusted basis, schools now have access to 22% more funding than they did a decade ago. This surge is partly due to a significant 65% increase in federal revenues, bolstered by one-time relief funds. However, the backbone of school funding—state and local sources—also saw robust growth, with each increasing by 18%.
Concurrently, the student population has experienced a slight decline, with approximately 500,000 fewer students enrolled, a decrease of 1.1%. This presents a curious paradox: schools are serving a diminishing number of students with substantially more financial resources than in previous years.
The National Averages Mask Wide Variation Across the States
While national averages paint a broad picture, the reality of school spending varies dramatically from one state to another. The average expenditure per student for the 2023-24 school year stands at $17,619. However, this figure is dwarfed in some regions, with New York and Washington D.C. exceeding $30,000 per student.
In stark contrast, states like Idaho, Utah, Arizona, Oklahoma, and Mississippi operate with significantly lower per-pupil spending, closer to the $11,000 to $12,000 range. These disparities highlight fundamental differences in educational investment and resources across the country.
Staffing Ratios Tell a Story of Investment
These spending differences often translate into varying staffing levels. In states like Vermont, there's one full-time staff member for every 4.3 students, a ratio mirrored in Maine, Connecticut, and other similar states. This suggests a higher degree of individualized attention and support for students in these regions.
Conversely, states such as Utah have an average of 11.3 students per employee, with Arizona, Idaho, and others also falling into this category. This indicates a more stretched workforce and potentially fewer support staff available to students.
"On average, public schools spent $17,619 per student in the 2023-24 school year. But there was enormous variation, with places like New York and the District of Columbia spending more than $30,000 per student, while states like Idaho, Utah, Arizona, Oklahoma and Mississippi spent closer to $11,000 or $12,000 per child."
The trajectory of spending also differs across states. While 47 out of 50 states and the District of Columbia saw real per-pupil spending increases over the last decade, some experienced declines. Alaska's per-pupil spending dropped by 13%, Montana by 6%, and Wyoming by 1%, illustrating the diverse fiscal paths states are taking in education.
Where is the Money Going? Not Primarily to Teacher Salaries
Despite the overall increase in school spending, a critical trend has emerged: this additional money is not significantly translating into higher teacher salaries in real, inflation-adjusted terms. While nominal salaries have increased, the purchasing power of the average public school teacher has actually declined by approximately $2,500 over the past decade.
The average teacher salary for the 2023-24 school year was $72,030, up from $56,610 a decade prior. This nominal gain is outpaced by inflation, meaning teachers today can afford less than their counterparts ten years ago. This stagnation in real wages is a pressing concern for the teaching profession.
The Expanding Workforce and Rising Benefit Costs
The explanation for this salary stagnation lies, in part, with an expanding school workforce. Schools are employing more individuals than ever before, including teachers, instructional aides, principals, assistant principals, guidance counselors, and student support staff. This growth means the available funding is spread across a larger number of personnel.
Beyond salaries, the cost of employee benefits—such as health insurance and retirement plans—has also risen substantially. For every $1,000 spent on salaries, schools are now paying an additional $438 in benefit costs. These escalating benefit expenses consume a significant portion of the budget, leaving less room for direct salary increases.
"On average, teachers today have less purchasing power than they did a decade ago."
This dynamic suggests that while schools may have more money overall, the increased cost of a larger workforce and its associated benefits is diverting funds away from direct compensation for teachers. This is a complex challenge that requires careful financial planning and policy consideration.
Within States and Districts, Spending is More Progressive Than You Might Expect
While the most significant spending variations occur between states, a more equitable distribution pattern often emerges within state and district lines. Schools serving students from lower socioeconomic backgrounds tend to receive more funding per pupil than those serving more affluent student populations.
Research indicates that Black and Hispanic students, as well as students eligible for free or reduced-price lunch, receive higher per-pupil allocations compared to their white and non-FRL peers. This suggests a conscious effort to direct resources toward students with greater needs.
Targeted Funding and Staffing for Needy Students
For example, in Atlanta, elementary schools serving higher percentages of economically disadvantaged students generally receive more funding per student than their wealthier counterparts. This pattern is observed nationally, with higher-poverty schools often allocated more resources.
However, the allocation of these resources can be nuanced. While lower-income and Black students may have more staff assigned to their education, these staff members are often less experienced and, consequently, lower-paid. This raises questions about the effectiveness of having more, less-experienced staff versus fewer, more-experienced educators.
Understanding these spending patterns is crucial for policymakers. For instance, a proposed class size cap in New York City schools, intended to benefit high-poverty schools, was found by researchers to be unnecessary as those schools already had the smallest classes. Implementing the cap would have required shifting resources away from wealthier schools, at a substantial cost.
Looking Ahead: Navigating the Trillion-Dollar Opportunity
As American schools navigate the fiscal landscape of a trillion-dollar revenue stream, several key trends are evident. We see increased overall spending, a declining student population, and an expanding workforce, yet teacher salaries have stagnated in real terms, and student outcomes remain uneven.
This moment presents a critical opportunity to move beyond simply asking if schools need more money. Instead, it calls for a deeper examination of how existing funds are allocated and whether current strategies are effectively serving all students. The next decade of school finance will hinge on the ability of policymakers to address these competing challenges and ensure that increased spending translates into tangible improvements for students and educators alike.
For educators seeking to enhance student engagement and streamline classroom management within this evolving financial context, exploring innovative tools is key. Platforms offering features like live classroom games, AI lesson planning, and efficient AI grading can help maximize the impact of available resources. Many of these tools are free for teachers to get started, offering immediate benefits without additional financial strain.




 Explore AI Teaching Tools
Comments (0)
Please login to comment
No comments yet
Be the first to comment on this article