
Navigating the California School Dashboard: A Comprehensive Guide for Parents and educators
Understanding how our schools are performing is crucial for fostering student success and driving educational improvement.The California School Dashboard offers a detailed, multi-faceted view of student achievement, school performance, and district accountability.
While designed to be informative, its complexity can sometimes be daunting.
This guide aims to demystify the dashboard, providing parents, educators, and stakeholders with a clear understanding of its purpose, structure, and how to leverage its insights for better education outcomes.
1.
The Purpose and Vision Behind the California School Dashboard The California School Dashboard serves as a vital tool for transparency and accountability within the state's education system.
Its primary objective is to provide a comprehensive overview of how every school, charter school, and school district is performing across a range of critical indicators.
This multidimensional approach moves beyond simple test scores to offer a more holistic picture of student well-being and academic progress.
The dashboard is intended to empower parents with accessible information about their child's school, guide educators in identifying areas for improvement, and hold districts accountable for their performance.
By presenting data in a visually engaging format, the aim is to foster informed discussions and collaborative efforts to enhance the educational experience for all students.
The Evolution of School Accountability
Historically, school performance was often reduced to a single numerical score, which could oversimplify complex issues and obscure significant achievement gaps.The California School Dashboard was intentionally designed to move away from this singular focus.
The vision was to create a system that emphasizes multiple measures of success, ensuring that a school's performance is evaluated based on a broader set of criteria.
This shift acknowledges that student success is influenced by many factors beyond standardized test results, including student engagement, school climate, and readiness for future academic and career pursuits.
2.
Deconstructing the Dashboard's Core Indicators The California School Dashboard evaluates schools and districts based on eight key state indicators, providing a robust framework for understanding performance.
These indicators are categorized to offer a balanced perspective on academic achievement and student engagement.
academic performance Indicators
- Standardized Test Scores: This includes performance in English Language Arts and Mathematics for students in grades three through eight and grade 11.
These scores offer a snapshot of foundational academic skills.
- English Learner Progress: A critical measure tracking the rate at which English Language Learners are progressing towards English proficiency.
This highlights the support provided to a significant student population.
- Science Performance: For the first time, science achievement in grades five and eight is included, reflecting the growing importance of STEM education.
Student Engagement and Readiness Indicators
- High School Graduation Rates: A fundamental indicator of a school's ability to keep students engaged and successfully complete their secondary education.
- College and Career Readiness: This indicator assesses how well high schools are preparing students for post-secondary education and the workforce.
It looks at factors like completing rigorous coursework and earning industry certifications.
- Chronic Absenteeism: Tracking the percentage of students who are chronically absent (missing 10% or more of school days) through grade eight.
High absenteeism is a strong predictor of academic challenges.
- Suspension Rates: This measure reflects the school climate and disciplinary practices, indicating the extent to which schools are fostering positive and inclusive environments.
3.
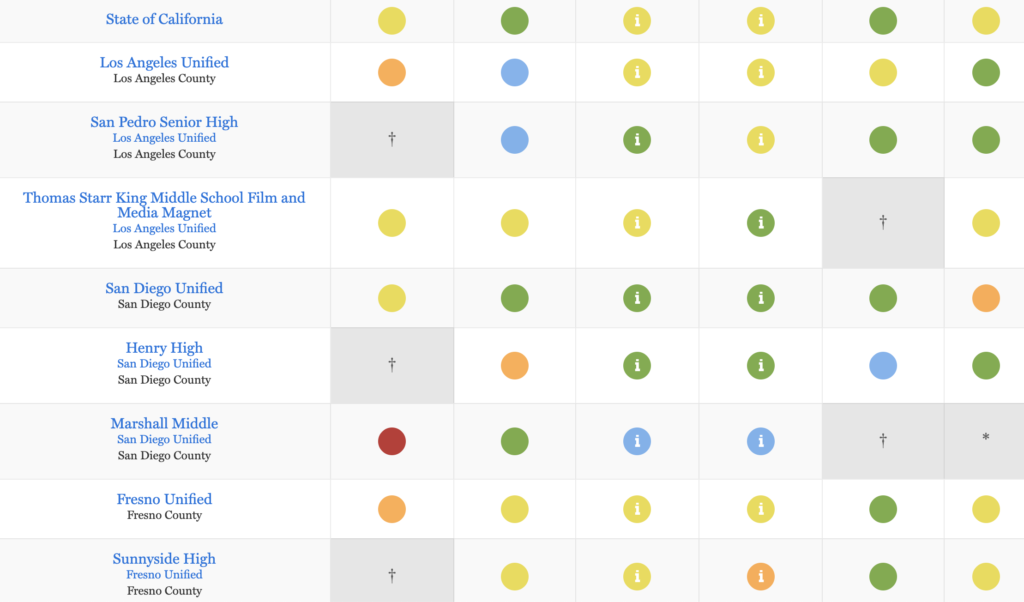
Understanding the Dashboard's Color-Coding System The distinctive color-coding system on the California School Dashboard is designed to provide an immediate visual cue about performance levels.
Each color represents a different performance rating, ranging from the highest to the lowest.
The Five Performance Levels
- Blue: Signifies the highest level of performance.
- Green: Indicates strong performance.
- Yellow: Represents performance that is meeting expectations but has room for improvement.
- Orange: Suggests performance that is approaching but not yet meeting expectations.
- Red: Signals the lowest level of performance, requiring significant attention and intervention.
The Dual-Factor Approach to Ratings
Each color rating is determined by a blend of two equally weighted factors:- Current Year Performance: The actual test score or rate for the current academic year.
- Change Over Time: The improvement or decline in performance compared to the preceding year.
For instance, a school might have a solid current performance but a declining trend, which could lower its overall color rating.
Conversely, a school with average current performance but significant year-over-year improvement might see its rating elevated.
This nuanced system aims to credit schools for growth and identify those experiencing declines that need immediate focus.
4.
The Significance of Multiple Measures and the Absence of a Single Score A deliberate design choice of the California School Dashboard is the absence of a single, overarching summative rating for a school or district.
This decision stems from a philosophy that reducing a school's complex performance to a single number or letter grade can be misleading and can mask critical disparities.
Focusing on Nuance and Equity
By presenting data across multiple indicators, the dashboard encourages a more comprehensive understanding of a school's strengths and weaknesses.This approach helps to:
- Highlight Achievement Gaps: Averages can hide the fact that certain student groups may be performing significantly better or worse than others.
The dashboard's disaggregated data brings these disparities to light.
- Promote Holistic Improvement: It shifts the focus from solely improving test scores to addressing a wider range of factors that contribute to student success, such as school climate and engagement.
- Encourage Deeper Analysis: Stakeholders are prompted to look beyond a single score and investigate the underlying reasons for performance levels across various indicators.
5.
The Crucial Role of Student Groups in Dashboard Analysis A cornerstone of the California School Dashboard is its detailed examination of performance across various student groups.
This disaggregated data is essential for identifying and addressing achievement gaps that might otherwise remain hidden within overall school or district averages.
Identifying Disparities and Targeted Support
The dashboard tracks performance for 14 distinct student groups, including various racial and ethnic categories, English Learners, students with disabilities, foster youth, and homeless students.Each of these groups receives a color rating for every indicator.
This granular data allows for:
- Pinpointing Underperforming Groups: It clearly shows which student populations are struggling on specific indicators, enabling schools and districts to direct resources and interventions effectively.
- Informing Local Control and Accountability Plans (LCAP): Districts are required to develop LCAPs, which are three-year improvement plans.
When a student group receives a red rating on an indicator, the LCAP must include specific actions and funding to address that deficiency.
- Promoting Equity: By shining a light on the performance of all student groups, the dashboard drives efforts to ensure that every student has the opportunity to succeed, regardless of their background or circumstances.
This provides a detailed view of how different schools within a district are performing for various student groups.
6.
Understanding Local Indicators: Beyond Standardized Metrics While the state indicators provide a standardized measure of performance, the California School Dashboard also incorporates "Local Indicators." These are crucial priorities for which statistically comparable statewide data is not readily available, but which are vital for the overall health and success of a school community.
Key Areas of Local Focus
Local indicators often include:- Family Engagement: How effectively schools are involving parents and guardians in their children's education.
- School Climate: The overall atmosphere and environment of the school, including safety, inclusivity, and student well-being.
- Access to a Broad Course of Study: Ensuring that students have opportunities to access a wide range of academic and enrichment programs.
This often involves data from school climate surveys, community feedback, and specific district initiatives aimed at improving these vital aspects of the educational experience.
For example, county offices of education may report on their coordination of services for vulnerable student populations like foster youth.
7.
How Dashboard Data Drives School Improvement and Accountability The California School Dashboard is not merely a reporting tool; it is designed to be a catalyst for continuous improvement and accountability within the education system.
The data presented has direct implications for how schools and districts operate and are supported.
Differentiated Assistance: A Support Mechanism
When a district demonstrates significant challenges, particularly if at least one student group is rated red on two or more priority areas (e.g., low academic scores coupled with high chronic absenteeism), it may be designated for "Differentiated Assistance." This designation is voluntary and offers schools and districts the opportunity to seek guidance and support from county offices of education or specialized state agencies like the California Collaborative for Educational Excellence.This assistance is intended to help them develop and implement strategies to address their specific areas of need.
Challenges and Re-evaluation
The high number of districts qualifying for Differentiated Assistance over the years, often due to persistent low ratings for students with disabilities and long-term English learners, has prompted ongoing re-evaluation.The State Board of Education periodically reviews the criteria for Differentiated Assistance to ensure it effectively targets districts that can benefit most from targeted support and to address overlooked, chronically underperforming student populations.
8.
Evolution and Potential Enhancements of the Dashboard The California School Dashboard is a dynamic system that has undergone several modifications since its introduction.
The State Board of Education regularly considers proposals to refine its indicators and reporting methods to better serve its purpose.
Key Changes and Future Directions
Over time, the dashboard has seen technical adjustments, new approaches to measuring long-term English learner progress, and significant development of the college and career readiness indicator.This indicator, for example, now assesses the percentage of graduates who meet rigorous criteria, such as completing UC/CSU A-G requirements, earning college credits, or achieving seals of biliteracy.
Suggestions for Improvement
Experts and stakeholders have offered valuable suggestions to enhance the dashboard's usability and impact:- Audience-Specific Portals: Creating tailored versions of the dashboard for different users, such as one for researchers focused on detailed data analysis and another for parents seeking straightforward comparisons for school choices.
- Consolidated Key Information: Presenting essential data points that answer the fundamental question "How is this school doing?" on a single, easily accessible page.
- Explicit Focus on Achievement Gap Progress: While subgroup performance is tracked, explicitly highlighting the progress (or lack thereof) in closing achievement gaps year-over-year is crucial.
- Integrated Student Growth Models: Incorporating robust student growth models that track individual student progress over time, rather than just year-over-year comparisons of similar students.
This can help identify effective instructional practices and areas for scaling successful interventions.
Conclusion
The California School Dashboard is an indispensable resource for understanding the intricate landscape of education in the state.While its comprehensive nature can initially seem complex, by breaking down its indicators, color-coding system, and the emphasis on student groups, its value becomes clear.
It moves beyond simplistic metrics to offer a nuanced view of school performance, driving accountability and fostering targeted improvement efforts.
For parents, educators, and policymakers, a thorough understanding of the dashboard is key to advocating for students, supporting schools, and ultimately, shaping a brighter future for education in California.
By leveraging the insights provided, we can work collaboratively to ensure that every student in every school district has the opportunity to thrive.







 Explore AI Teaching Tools
Comments (0)
Please login to comment
No comments yet
Be the first to comment on this article